Glaciology is Mathematics: The perspective of a master of mathematics student
James Headen, Elizabeth City State University

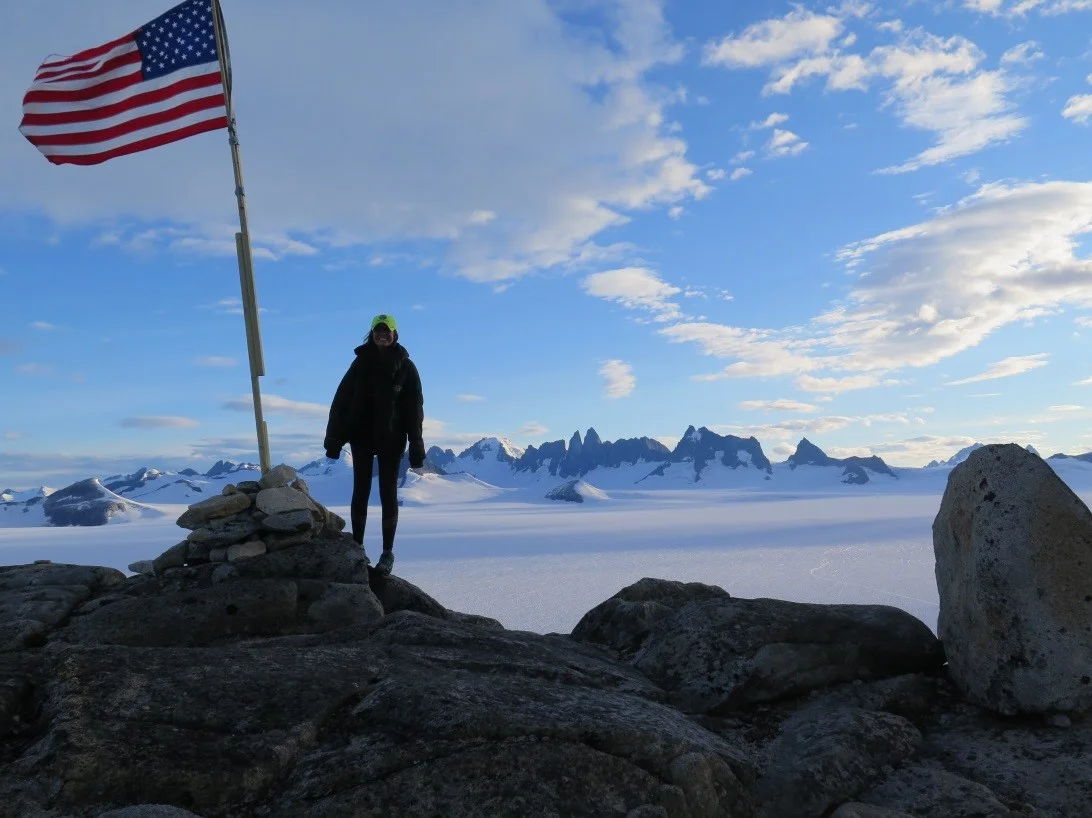
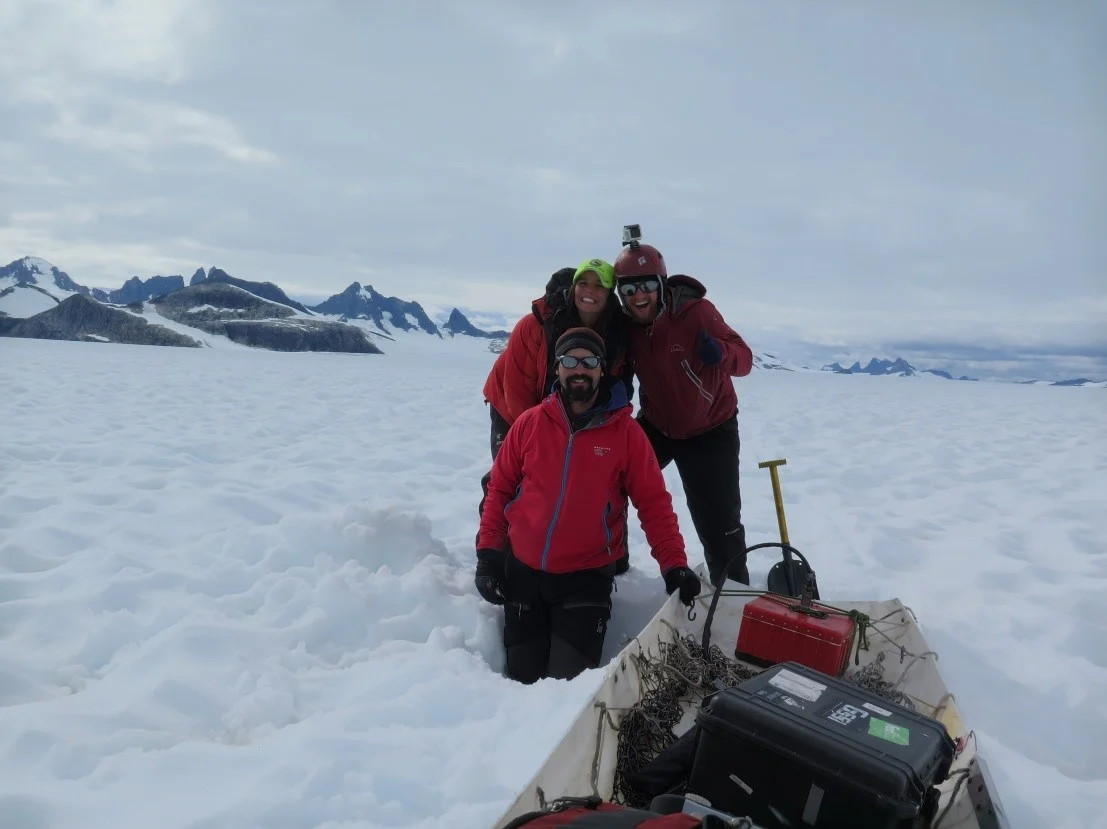
Panorama of Camp 10. Photo by author
ʃ8xdx...2x²+2x²… 3a=12x², regardless of the equation, there exists an explicit solution (definition: a function expressing a solved relationship between variables). Although mathematics has its share of implicit solutions (definition: an unsolved relationship between variables), the solution still has a variation of some finite (definition: known value) equation. Glaciers on the other hand, have so many unknowns that solving or drawing near a conclusion can be overwhelming. And that is the exact reason I’m drawn to nature’s canvas.

Sunset view looking westward from Camp 17. Photo by author.
My background is strictly mathematics and physics, therefore any knowledge gained about glaciers is extremely new. I am a novice with any activity associated with glaciers and even using glacier terminology is unfamiliar. Such subjects as basal sliding, surface velocity or even measurements of movement uses an amazing quantity of mathematics. For instance, flux quantities are a mathematical representation of glacier movement. I enjoy observing the effects a simple derivative can have on glacier factors. For instance, constructing a simple differential equation with parameters such as height, length, gravity, and variables that represent changes in position interval exponents, produces a surface velocity at a specific point. Together, a motivated group of individuals and I are using these equations to create a cross-section model of the Taku Glacier. My portion focuses on using differential equations, the Pythagorean Theorem and GPS coordinates to extract surface velocity for specific points. Every day is the perfect balance of lab time with your project team and field time to experience the JIRP tradition.

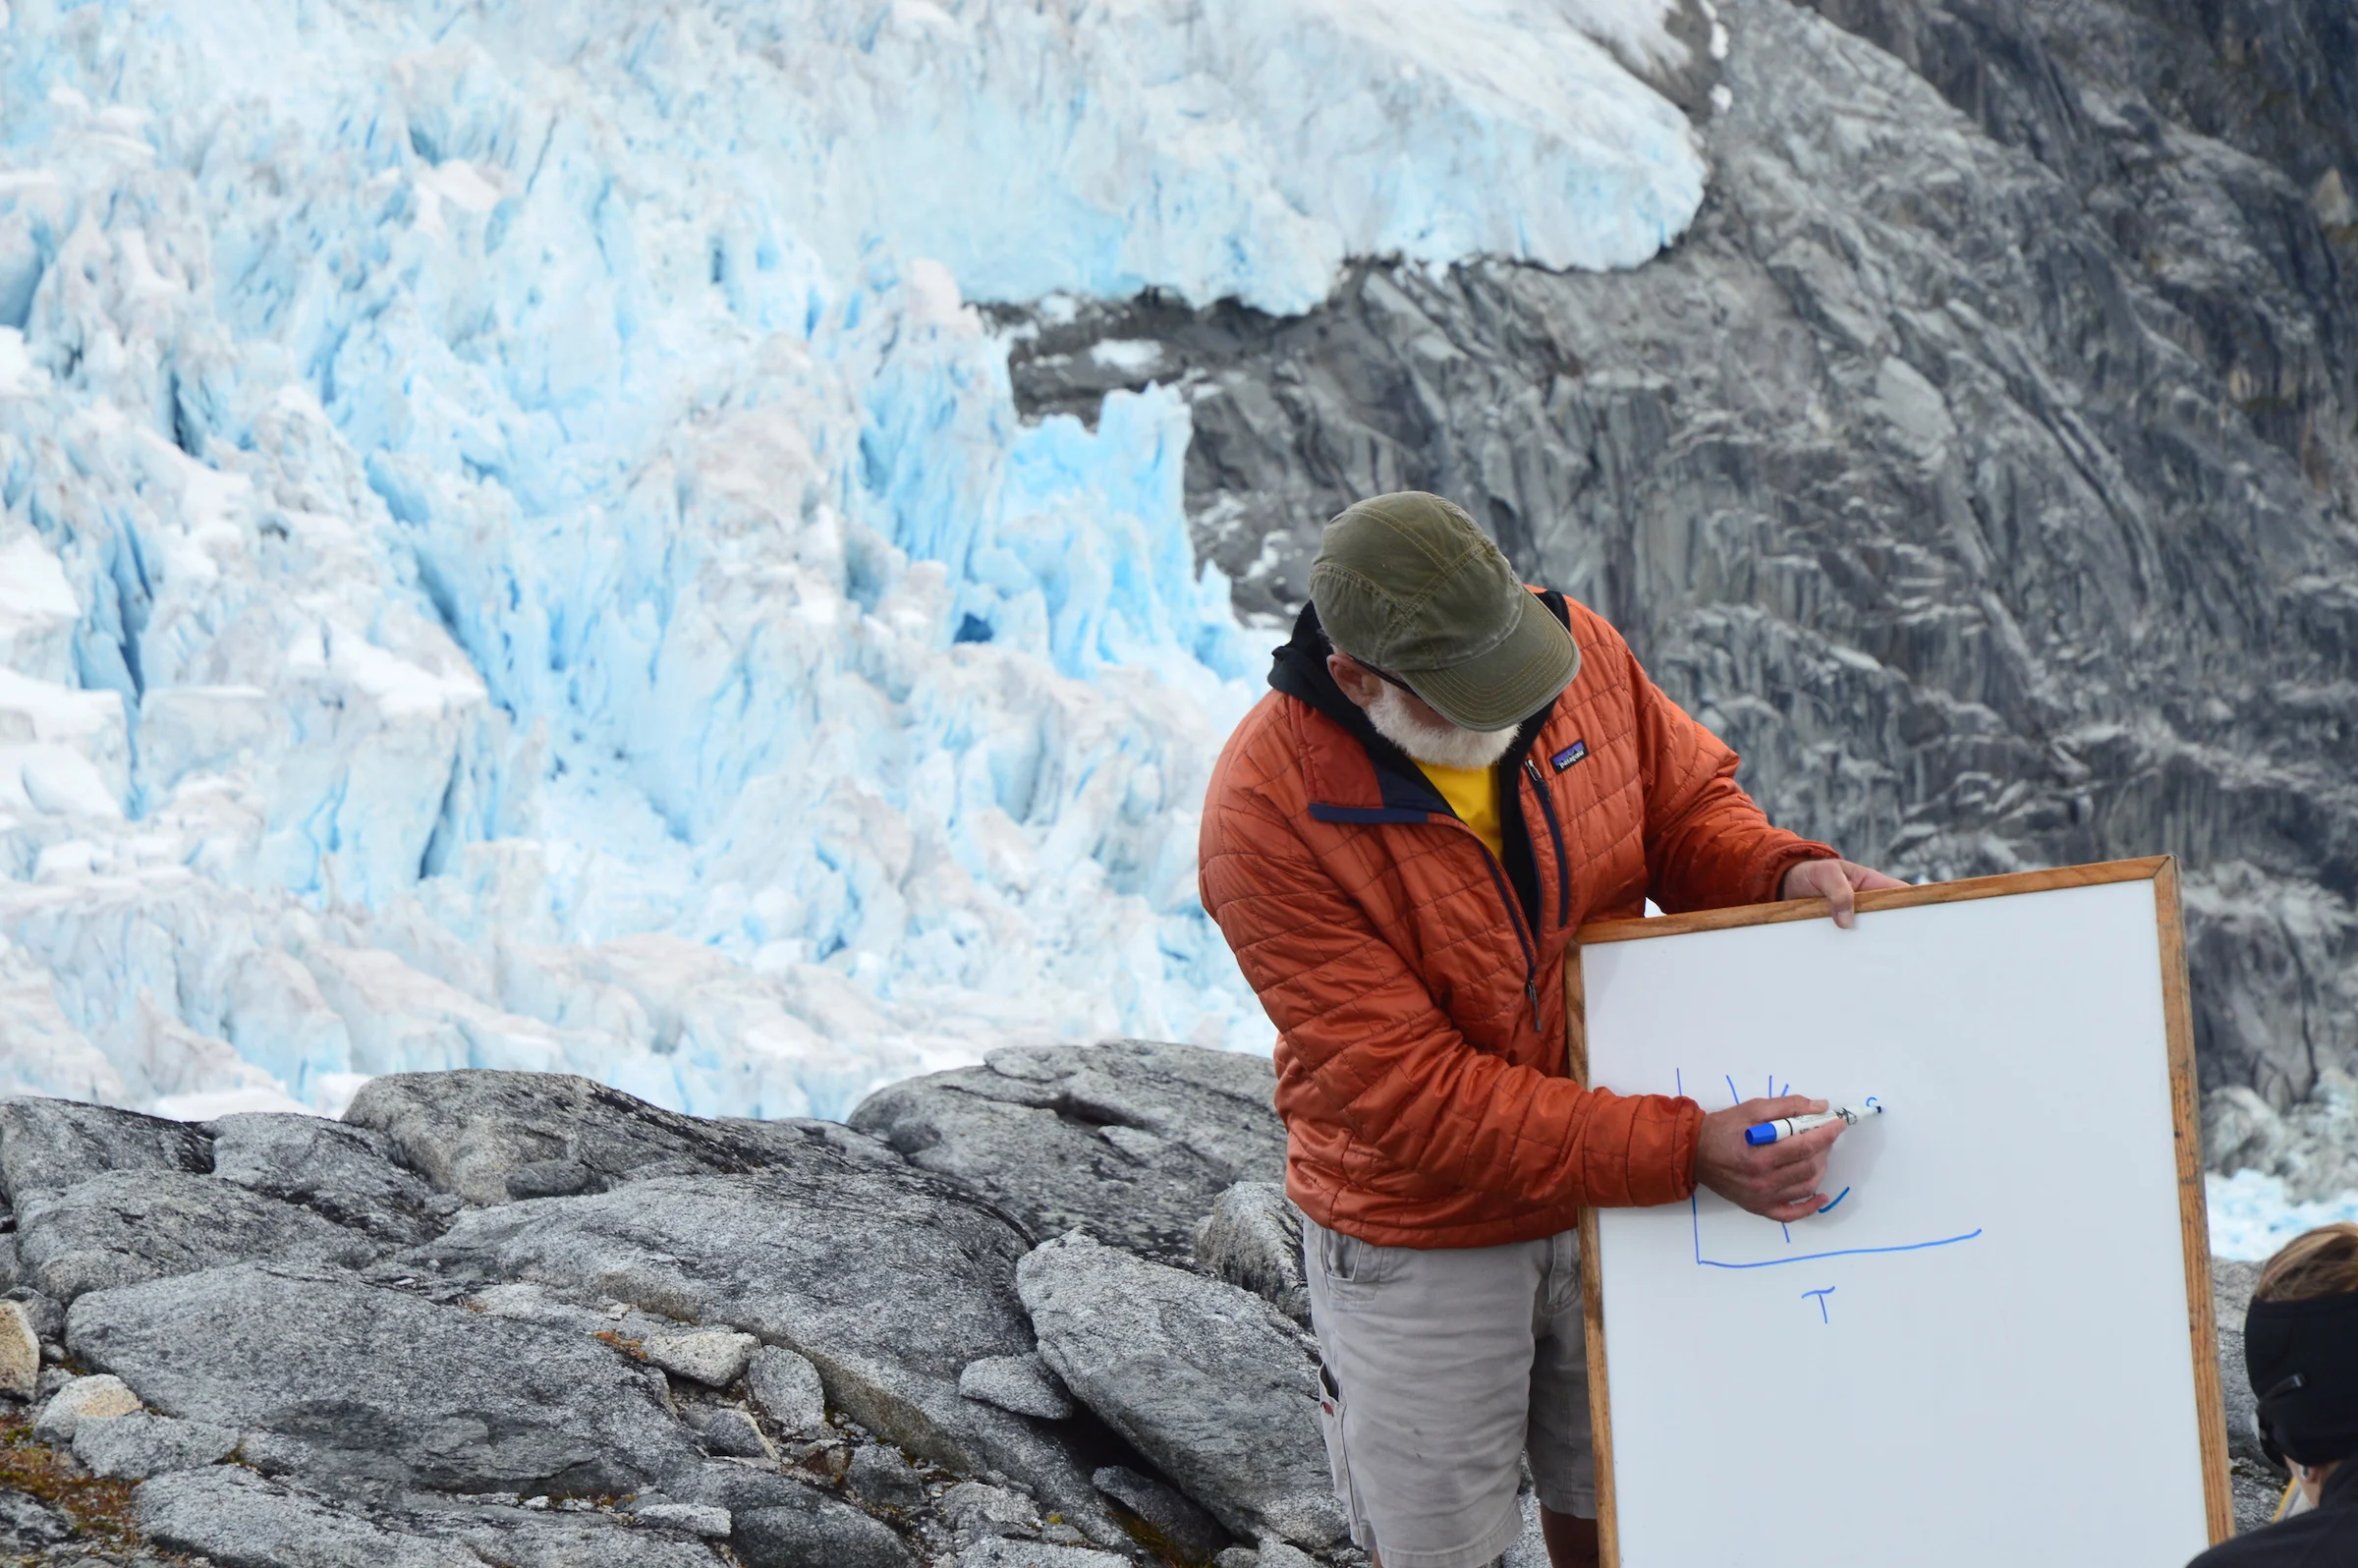
Representation of velocity flow along a glacier surface
Originally, I felt my mathematics would be put in the back corner during the length of the program, but I have experienced quite the opposite. Consequently, I can honestly say JIRP has a little bit of something for everyone. Whether it’s the mathematics student, the biology student, the programmer or even the outdoor enthusiast, each interest has life here at JIRP.

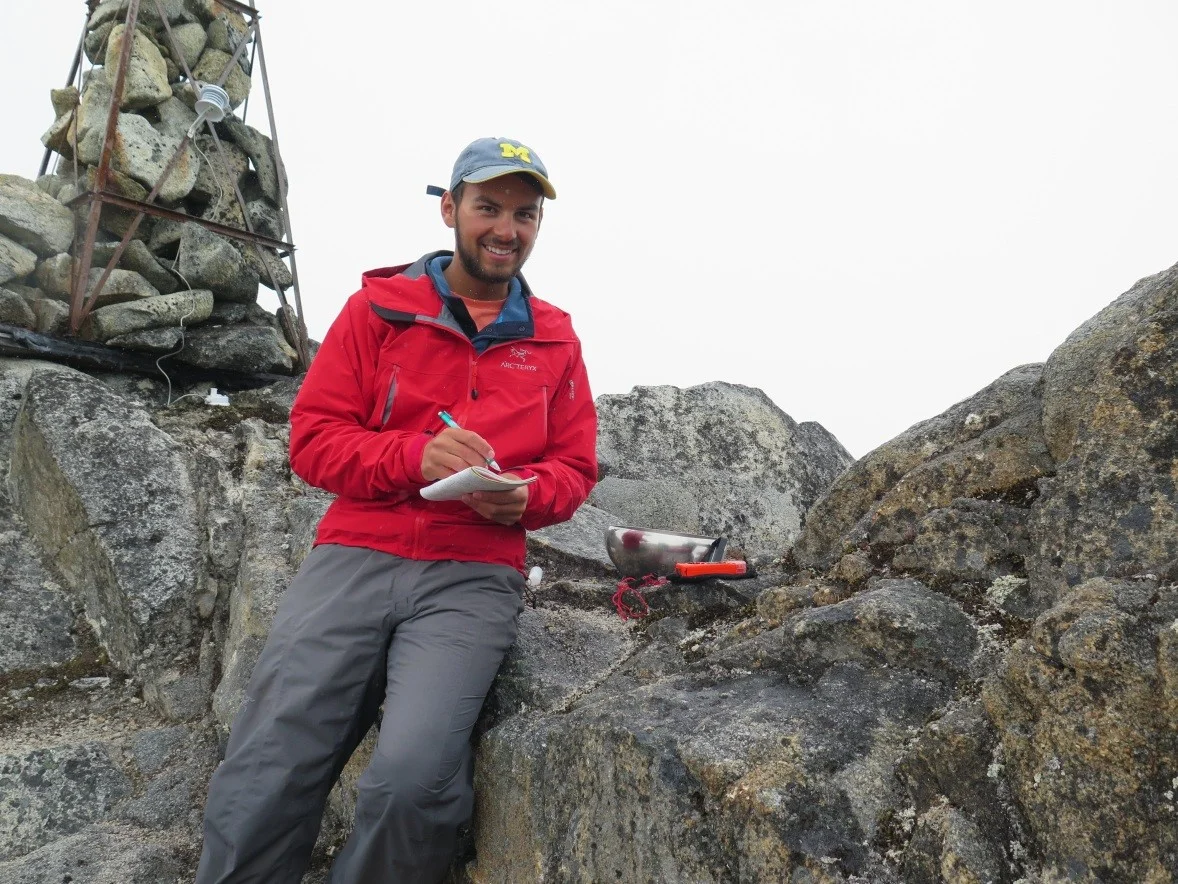
Mathematics is everywhere……even at camp 18. Photo by author.
But can math really answer the deep questions of the icefield? My honest answer is YES!!
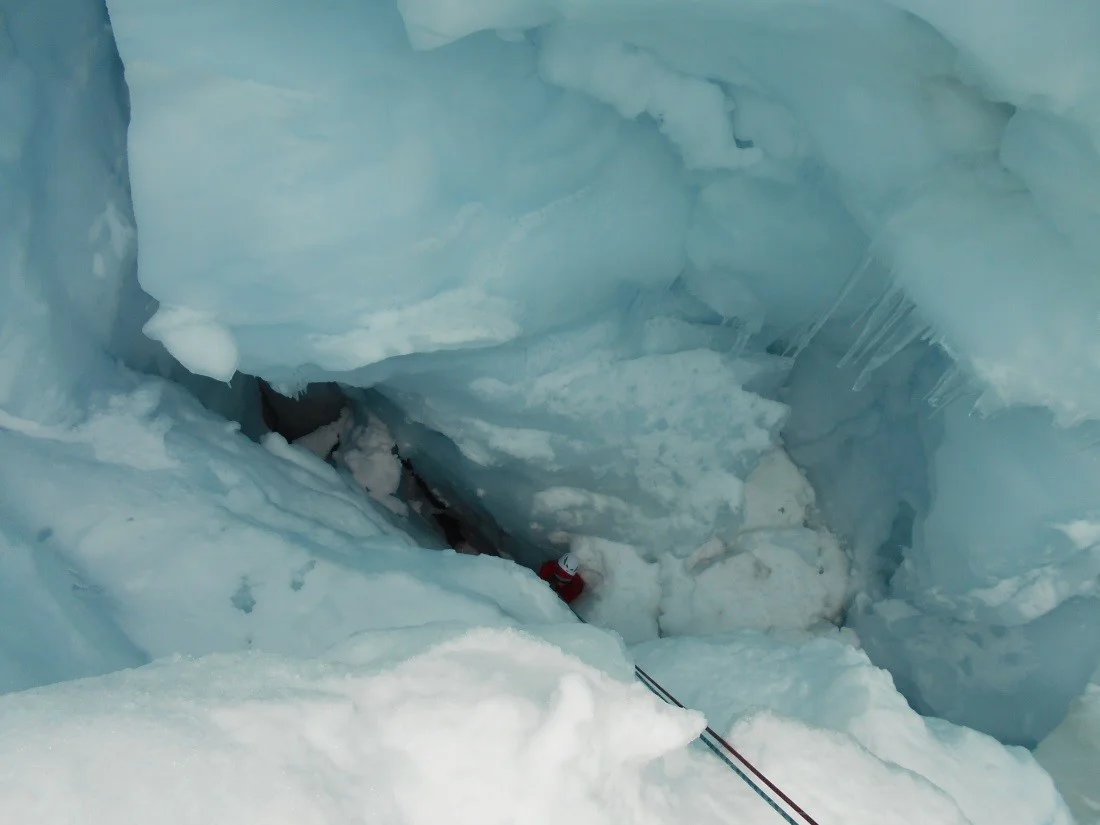
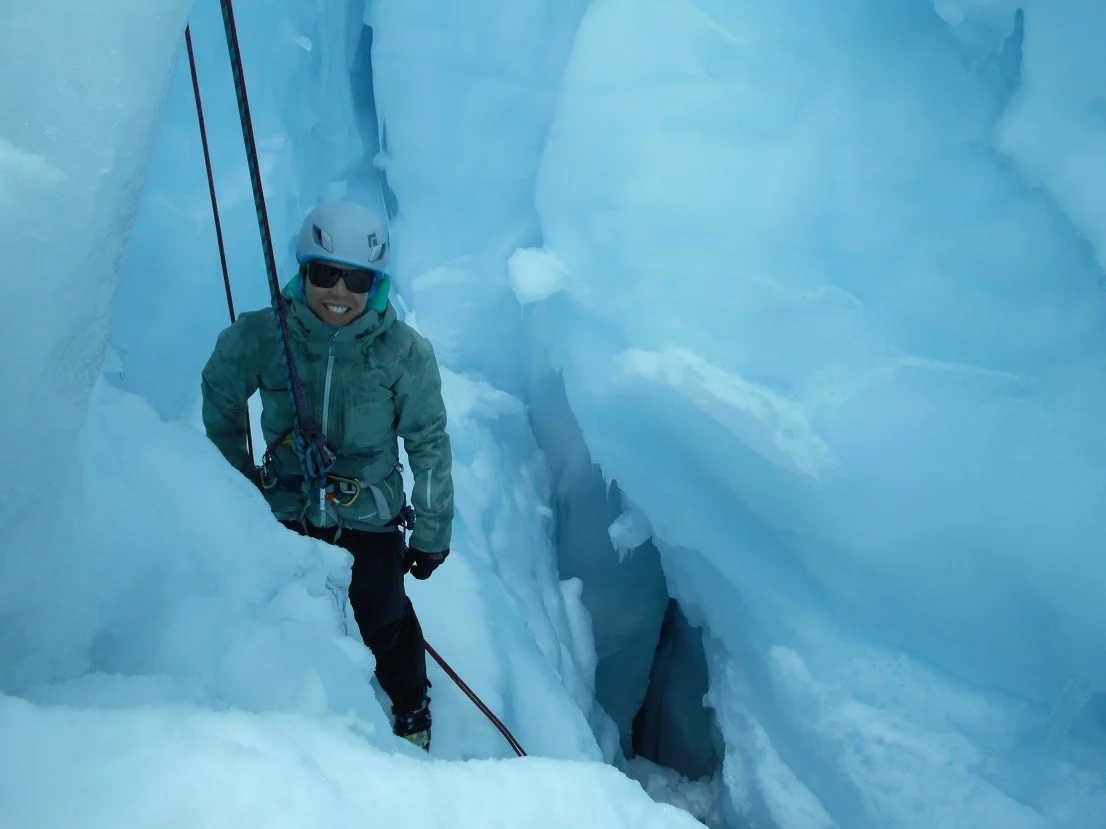
To understand the icefield requires mathematics. Math helps us understand glacier behaviors. In understanding the movement of glaciers, we can track possible areas of crevasses and map the general topography. Knowing these characteristics will increase safety for future exploration.
Mathematics helps us understand how climate impacts glaciers and in turn helps us understand how glacier change influences downstream ecosystems. Nature is math. To understand nature, we create mathematical representations (also known as models) to describe and predict its cycles. Through this we can prepare for future changes in our environments.
So to the aspiring JIRPmaticians, math lives here on the icefield!