Matt Beedle
JIRP Director of Academics and Research
As we work through the application materials for JIRP's prospective 2017 cohort (amazing applicants, by the way!), I'm reminiscing on this process from a year ago and the phenomenal JIRP class of 2016. JIRP, of course, is a research program, an educational expedition. The more years I'm involved in JIRP, however, the more I realize that it is the community of JIRP that is transformative. In the words of Dr. Maynard Miller, reflecting on why he was so drawn to the program he helped shape and led for decades:
“I can’t get away, because you’re all so wonderful!”
After completing the summer field season, the 2016 cohort went their separate ways, but continued their summer research, building towards the American Geophysical Union's Fall Meeting in early December where they presented their work. Half of our 2016 cohort of 32 made the trek to San Francisco to present, expand their scientific understanding and connections, and enjoy a number of gatherings with JIRP alumni and faculty. Engaging once again with this talented group of young scientists, introducing them to the larger JIRP family of alumni and faculty, and helping them make connections on their career paths was a real highlight of AGU 2016. The JIRP team is proud of your work and we are excited to build upon these efforts with JIRP's 2017 students!
Please see the images and text below for a team-by-team synopsis of student research presented at the 2016 AGU Fall Meeting:
BIOGEOCHEMISTRY: Team members Annie Holt, Annie Zaccarin, Auri Clark and Molly Peek (left to right in image below), present their group's work.


Abstract: Previous work has characterized chemical weathering in polar, polythermal, and alpine settings. However, chemical weathering and the role of supraglacial streams within the carbon cycle on the Juneau Icefield glacial system is not well documented. This study examines the concentration and spatial variability of alkalinity and major ions present in the ablation zone of the Llewellyn glacier, which is on the northeast side of the Icefield in Canada.
In particular, we explore how differences in chemistry are associated with source area reflectivity. By conducting measurements to characterize melt chemistry and alkalinity, we present results of a spatial variation survey of the Llewellyn Glacier ablation zone and relate the findings to surface albedo. We sample 30 locations in August 2016 during the late ablation season using a Hach digital titrator, ion chromatograph and an albedometer to measure alkalinity, major ion concentrations and albedo respectively. We characterize the relation between alkalinity concentrations and dust patterns and compare our data to other glacial systems. This study contributes to the larger understanding of chemical weathering in glacial environments.
BOTANY/ECOLOGY: Deirdre Collins presents her team's work.


Abstract: Alpine environments are particularly vulnerable to climate change, and alpine plant populations of the Juneau Icefield are currently experiencing increased environmental stress. In this study, vascular plants on selected nunataks of the Juneau Icefield of the Coast Range Mountains are investigated. Sixty meter transects spanning an elevation range are collected along prominently vegetated portions of each study site. The population of vascular plants found is considered in relation to the nunatak soil microbiota, elevation, latitude, nunatak emergence and geology. Results indicate previously unknown variations in nunatak soil microbiota and provide baseline data that may be used for future studies.
GEOPHYSICS: Tae Hamm, Dr. Kiya Riverman and DJ Jarrin present the geophysics team's 2016 research.


Abstract: High resolution measurements of spatial ice thickness variability on the Juneau Icefield are critical to an understanding of current glacial dynamics in the Coast Mountains of Southeast Alaska. In particular, such data are lacking on the Taku Glacier, a tidewater glacier in the Juneau region whose unique advance has slowed in recent years.
Significantly, such information is necessary to develop an accurate description of ice dynamics as well as sub-surface hydrology and bedrock erosion. Utilizing relative gravimetry, we sought to modify existing parameterized models of ice thickness with field measurements taken along the centerline of the Taku. Here we present a three-dimensional representation of ice thickness for the Taku, based on in situ observations from July 2016. As the glacier approaches a potential period of rapid terminal retreat, this data gives refined physical information prior to this potential juncture in the tidewater cycle-an observation that may yield insight into marine ice sheet instabilities more broadly.
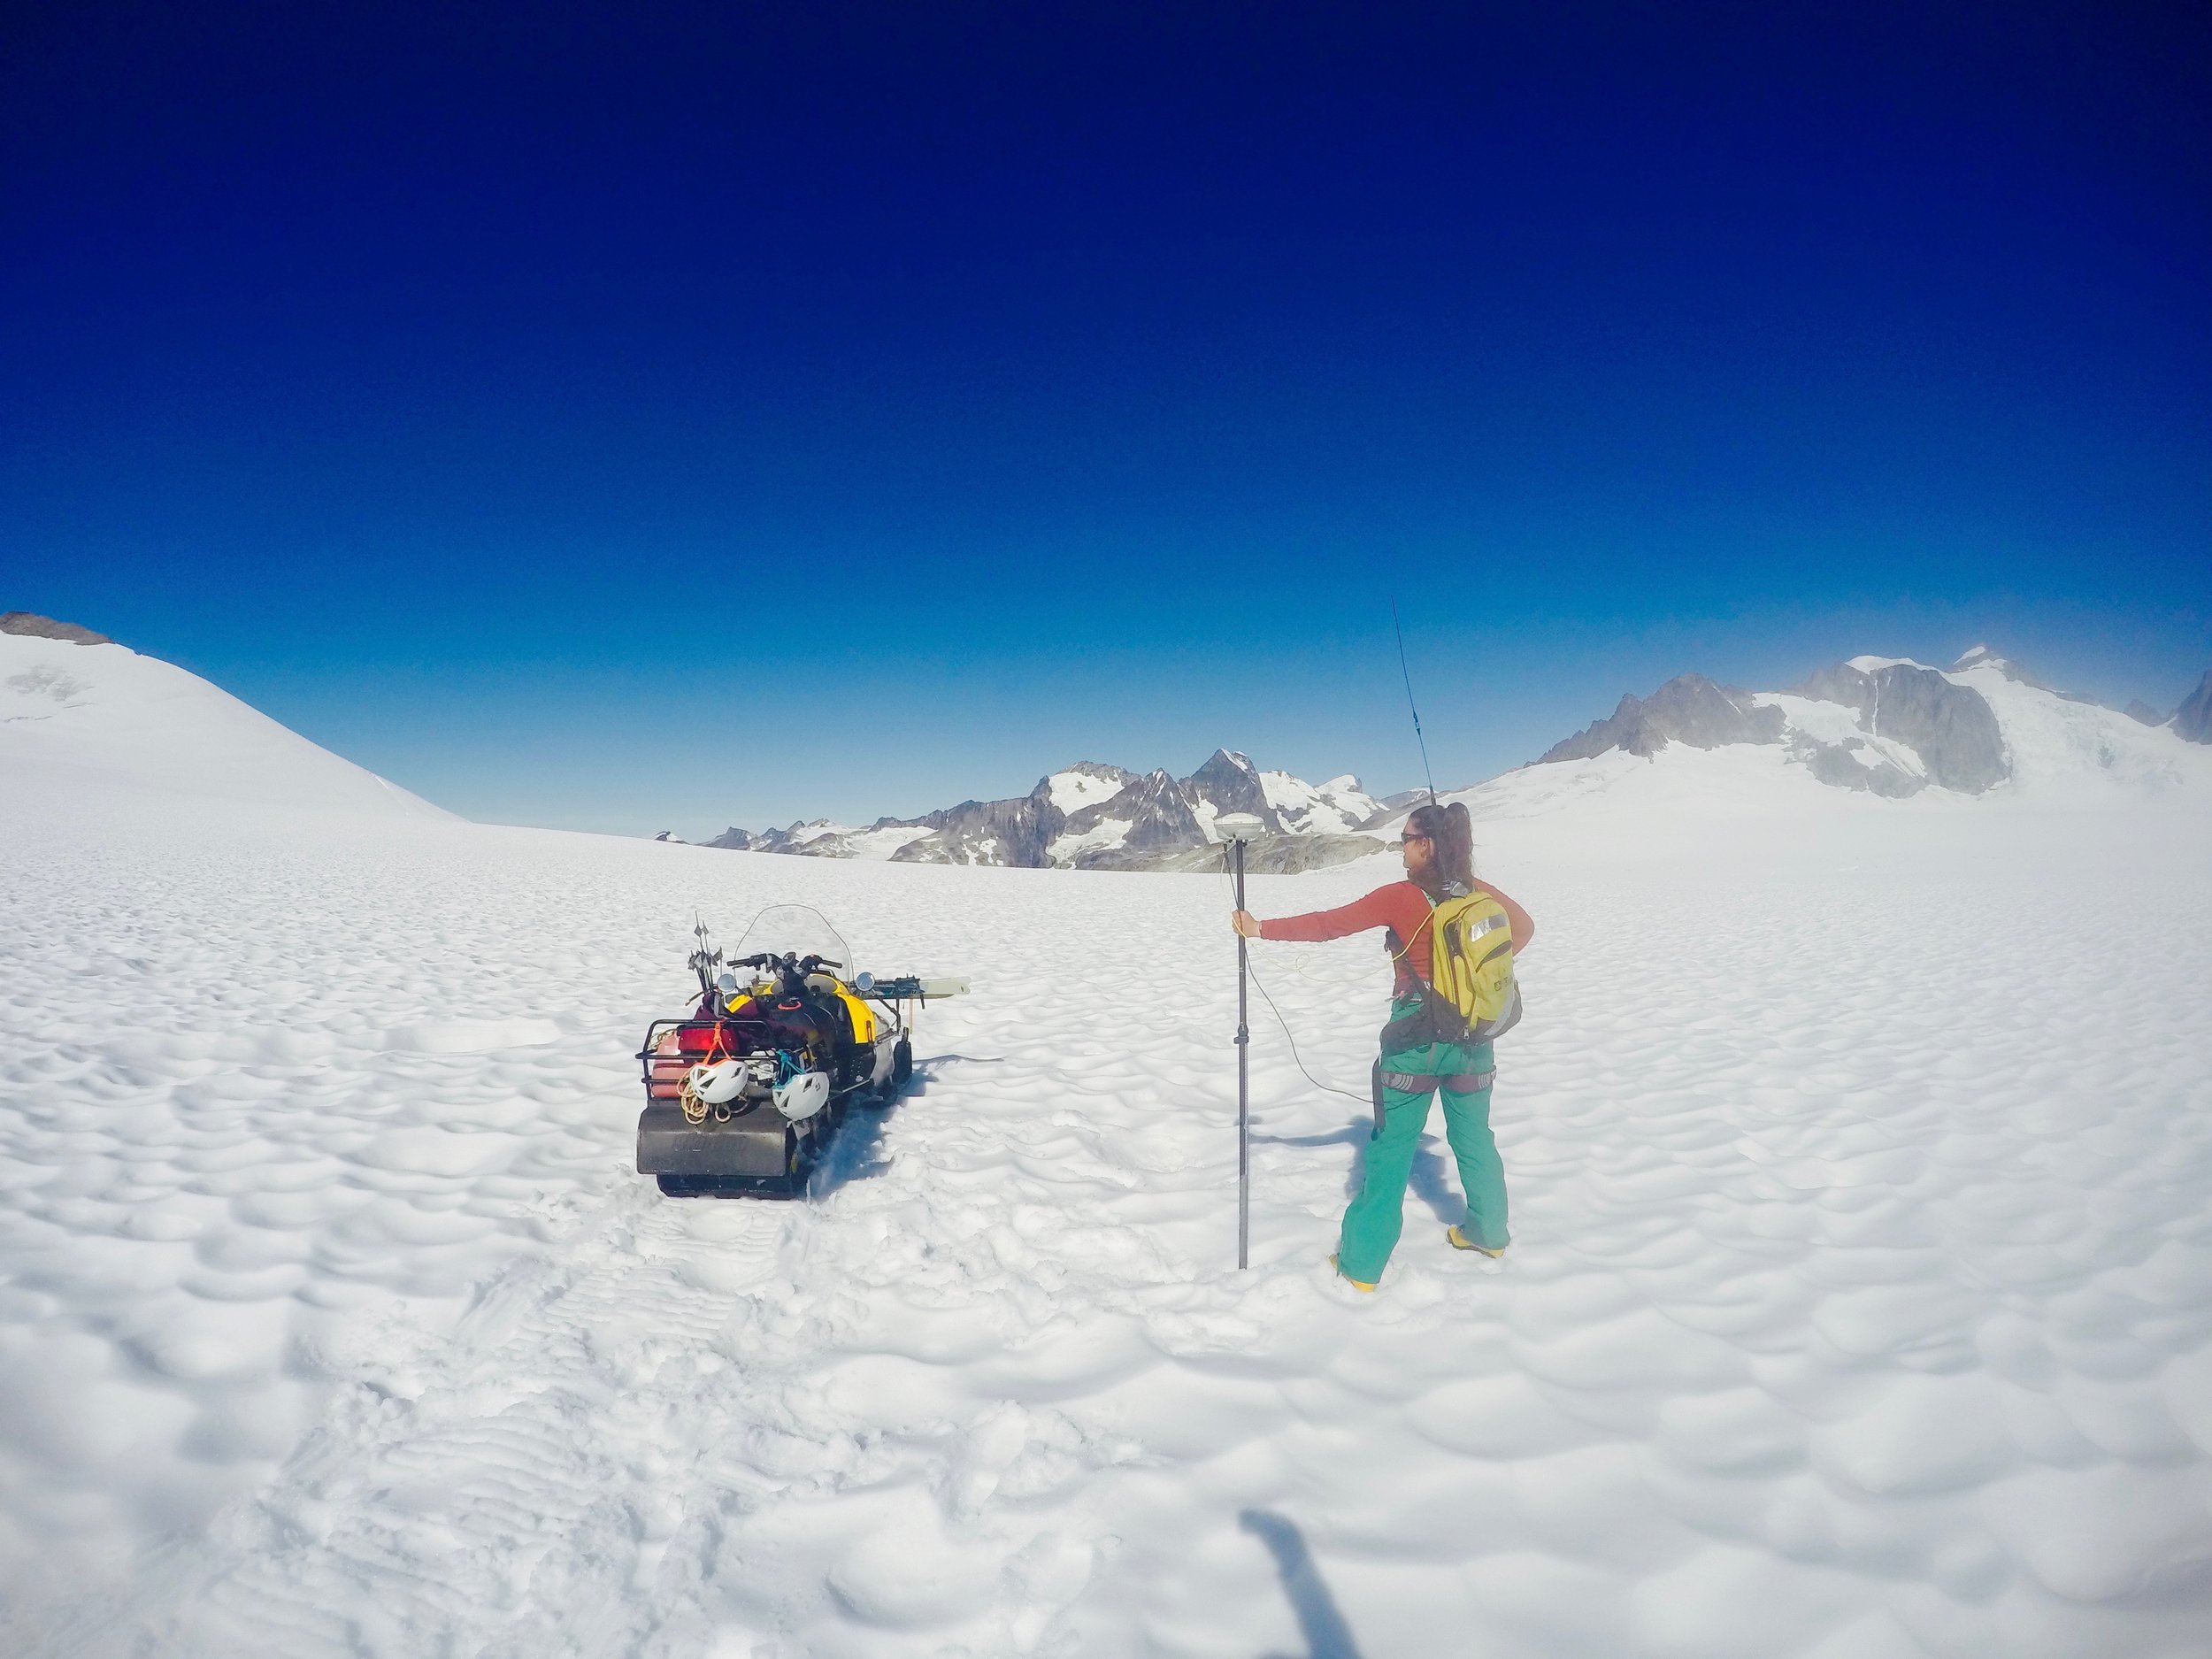
GPS SURVEY: Brittany Ooman (with the assistance of DJ Jarrin) presents the survey team's work from 2016.


Abstract: Glaciers are retreating at unprecedented rates worldwide, but the Taku Glacier in Southeast Alaska underwent a recent advance. As part of the Juneau Icefield Research Program, glacier surface elevation and short-term velocity are measured annually during the summer season along longitudinal and transverse profiles using a real time kinematic global positioning system (GPS).
We compared our survey results from 2016 to those of recent decades to determine changes in surface elevation and velocity over time. The observed changes are discussed in relation to the available bed topography data. In addition, we generated a detailed surface model and measured the pattern of local surface flow to constrain the location of the Matthes-Llewellyn divide, and determine if it is migrating through time. The results will help us understand the evolving dynamics of Taku glacier.
ISOTOPE GEOCHEMISTRY: Cezy Semnacher and Mo Michels present the 2016 efforts of the JIRP isotope team.


Abstract: The glaciers and climate of Southeast Alaska are currently changing, and the water isotopic record stored within these glaciers can act as an informant of this variability. Toward this end, it is necessary to understand the modern relationship between environmental factors and the patterns of water isotope variability. In this study, we present a spatio-temporal survey of water isotopes in precipitation on the Juneau Icefield of Southeast Alaska, carried out through the Juneau Icefield Research Program during the summer of 2016.
Samples were collected from 75 kilometers of surface transects, seven pits, and three cores of the annual snow pack, including repeat measurements to test for isotopic alteration from rainfall events. Measurements span three glaciers, a range of elevations, and multiple climate zones. Results, including those from annually repeated surface transects, were compared to data collected in the summers of 2012 and 2015.
Data from 2015 show an icefield-wide trend between δ18O values and elevation. However, a locally reversed trend was identified across the Taku Glacier. The data collected from this study will help to explain this unexpected result. Comparisons are made to other environmental factors including annual average temperature, distance from the coast, and the influence of different weather patterns.
Understanding the spatial and temporal patterns of isotopes across the Juneau Icefield will allow for a deeper understanding of the local relationship between these tracers and climate. This understanding is critical to interpreting water isotopes as a proxy for climate changes in the past.
MASS BALANCE: Dr. Shad O'Neel, Kate Bollen, Olivia Truax, Evan Koncewicz, Tai Rovzar and Alex Burkhart present the mass balance team's 2016 research.


Abstract: The Juneau Icefield Research Program has collected mass balance data over the last 70 years on the Taku and Lemon Creek glaciers. We analyze data from 2004-2016 to investigate the interannual variability in the accumulation gradients of these two glaciers from ground penetrating radar (GPR), probing, and snow pits. Understanding interannual variability of accumulation gradients on the Juneau Icefield will help us to interpret its long-term mass balance record.
The Lemon Creek Glacier is a small valley glacier on the southwest edge of the Icefield. GPR data was collected over the glacier surface in March 2015 and 2016. In July of 2014 and 2016, the accumulation area was probed for snow depth, and two snow pits were dug for snow depth and density. The accumulation gradients resulting from each method are compared between years to assess the interannnual variability of the accumulation gradient and the resulting glacier wide mass balance.
The Taku Glacier is the largest outlet glacier on the Juneau Icefield. We use three snow pits dug each year along the longitudinal profile of the glacier between ~1000m and ~1115m, the region that typically reflects the ELA. In 2004, 2005, 2010, 2011, and 2016, snow probing was continued in the central region of the Taku and the resulting gradients are compared to each other and to the gradients derived from the snow pits. We assess the resulting impact on glacier wide mass balance furthering our understanding of the state of these two well-monitored glaciers on the Juneau Icefield.
PLANNING FOR 2017: We are excited to build upon these research efforts and also expand in new and exciting research directions. Stay tuned for more information on our 2017 season in the coming weeks!
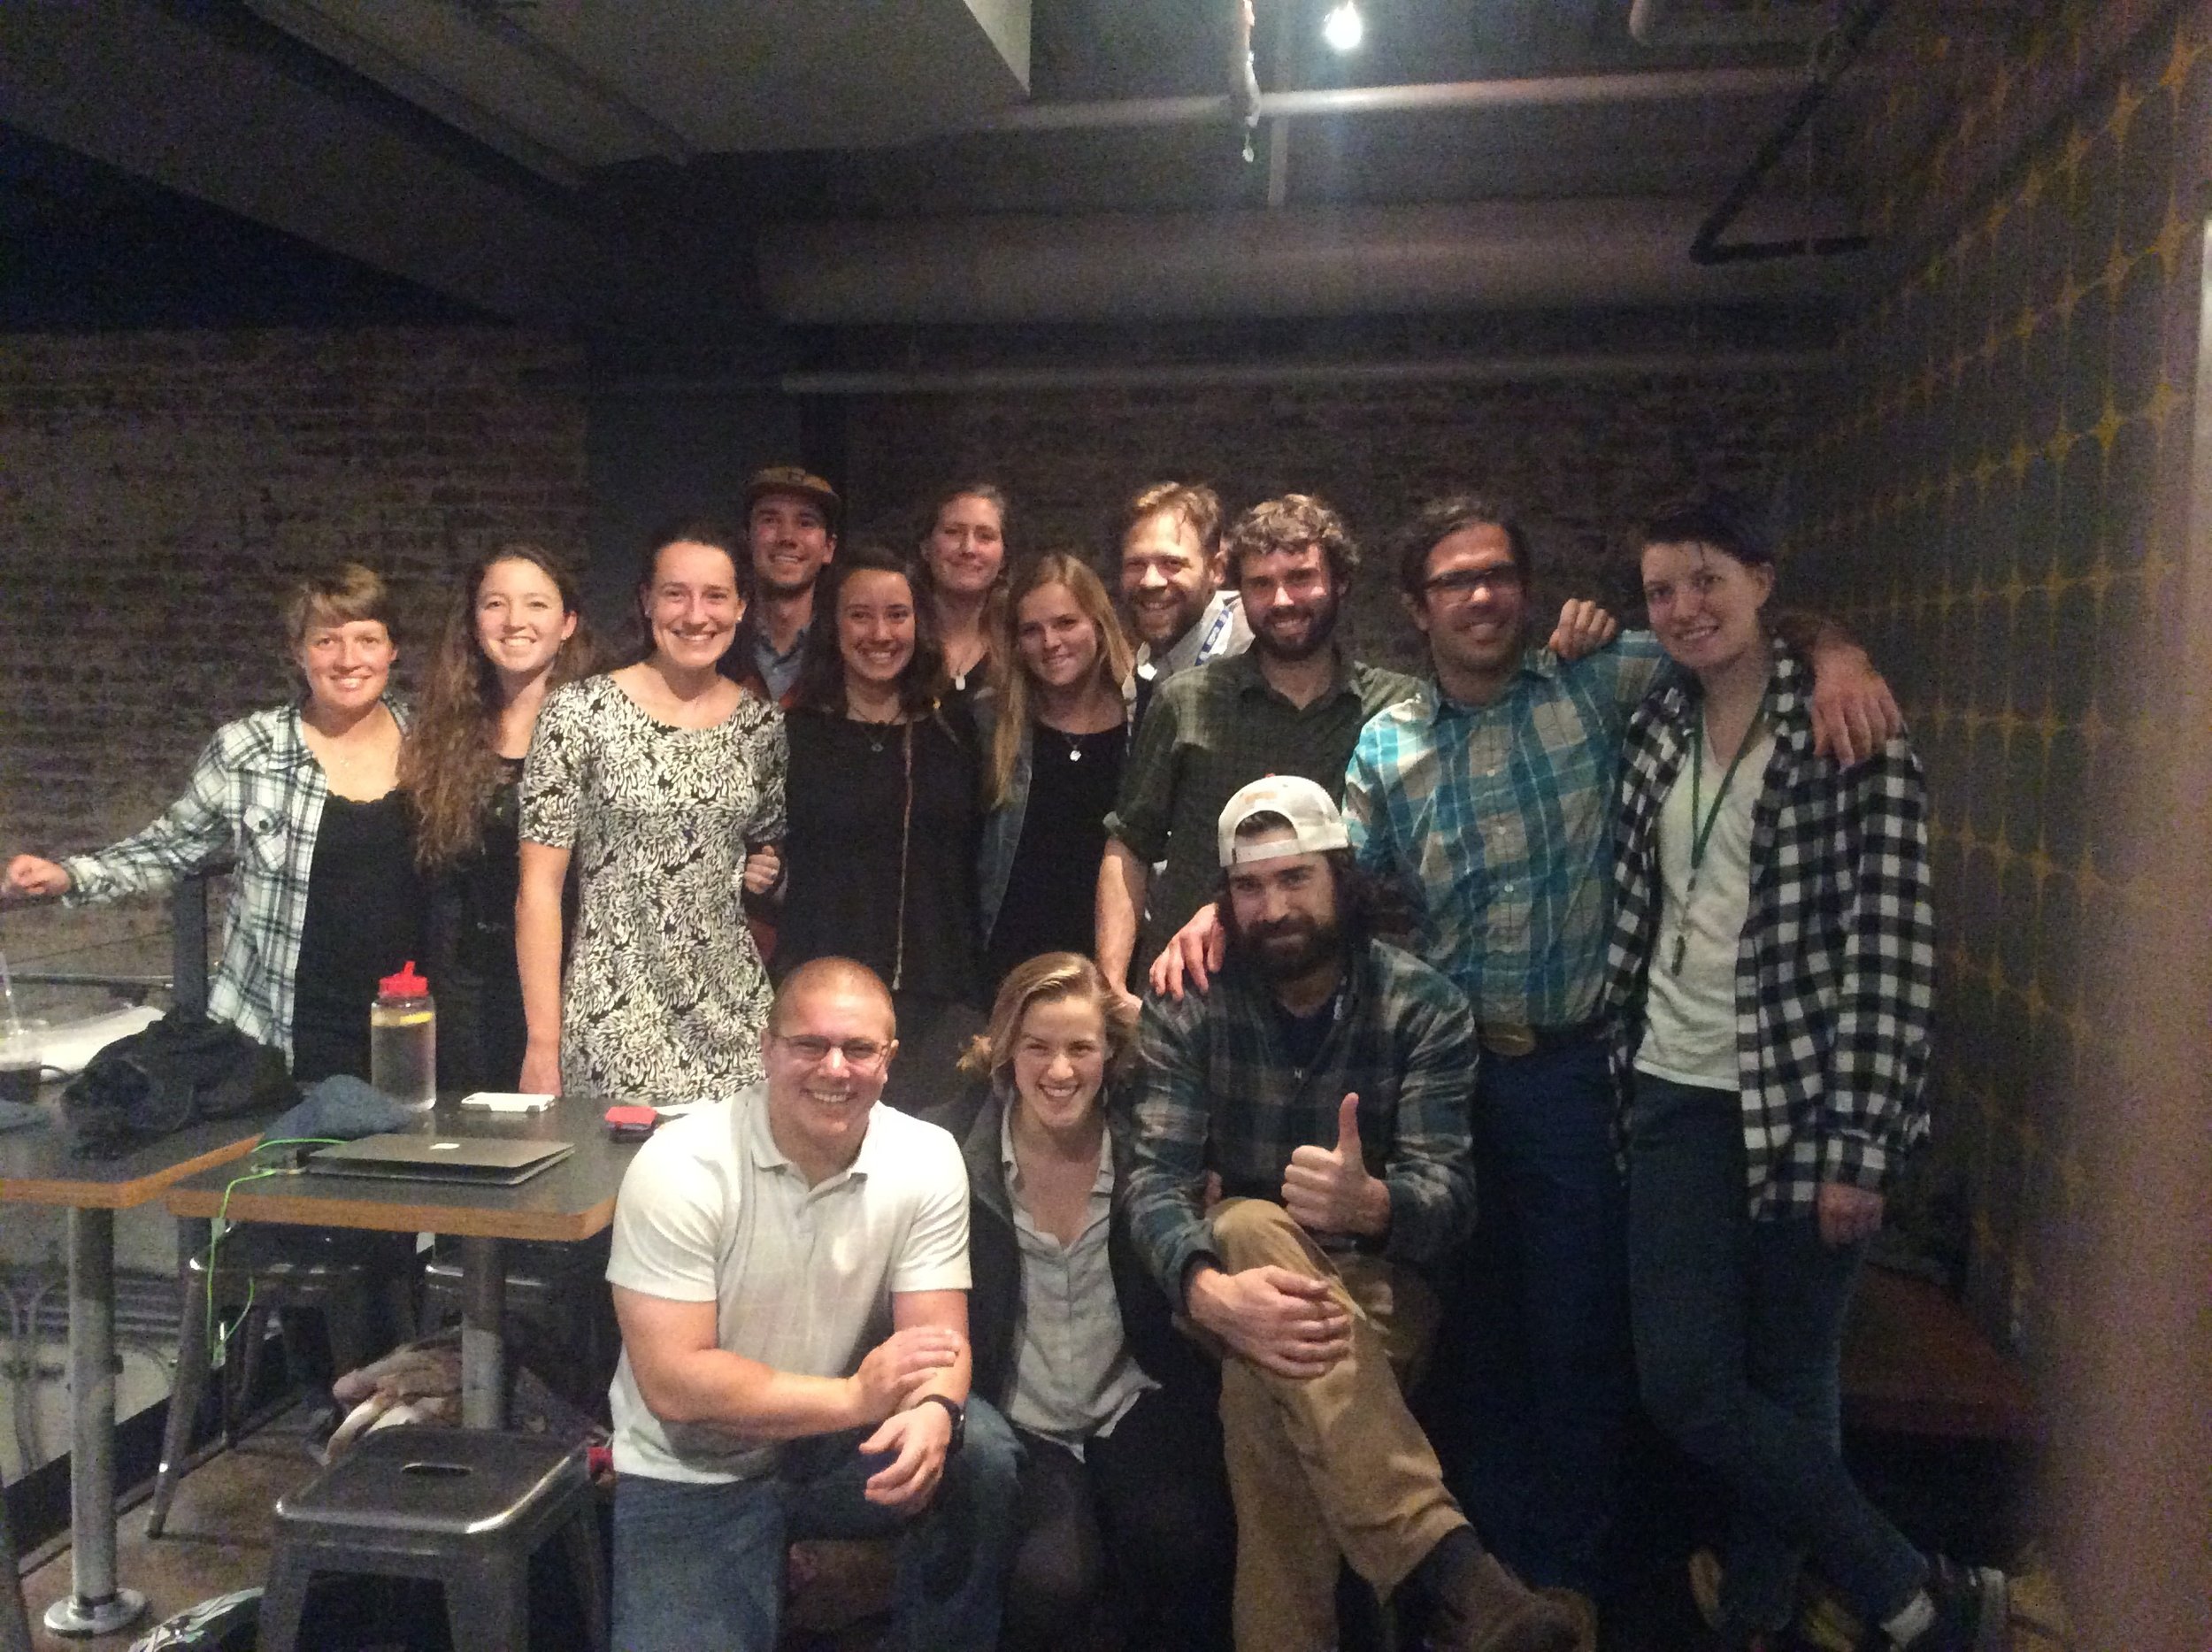
A portion of the JIRP crew at the 2016 AGU Fall Meeting gathers for dinner after a day of science in San Francisco.
Back row: Annie Zaccarin, Annie Holt, Olivia Truax, Evan Koncewicz, Kate Bollen, Molly Peek, Deirdre Collins, Matt Beedle, ????, Brad Markle, Tai Rovzar. Front row: DJ Jarrin, Cezy Semnacher, Chris McNeil